Satellite indices
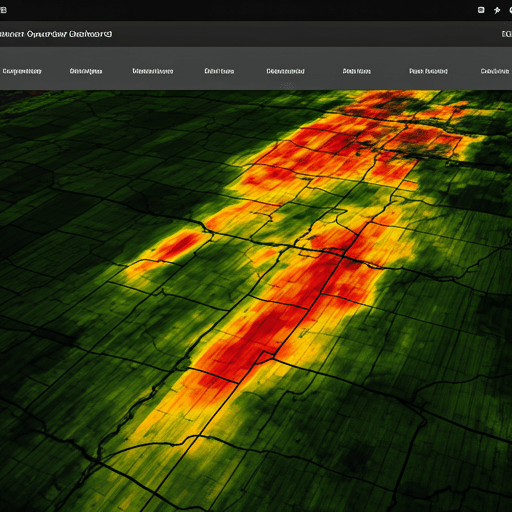
NDVI, NDWI, EVI, MSAVI, NDMI, NDRE, ReCI and SAVI drawn over your boundary, with exact values on hover.
One platform replaces site visits, spreadsheets and paper claim files.
NDVI, NDWI, EVI, MSAVI, NDMI, NDRE, ReCI and SAVI drawn over your boundary, with exact values on hover.
Switch on a slider to compare two, three or four indices on the same map, and read each side's real value.
Forecast, heat and cold stress and rainfall tracking at your field's exact location.
Drought, heat, frost, flood and crop-failure triggers open a claim the moment they are reached.
Photos and remarks are checked against the satellite record, and every decision is logged.
New documents, payments, claims and weather warnings reach the right person as they happen.
Sketch a polygon, rectangle or circle, or import a KML file, then fine-tune it on the map.
Role-based access and per-user data isolation. Share a field only with the institutions you choose.
The whole workspace is available in both languages, in Pakistani rupees.
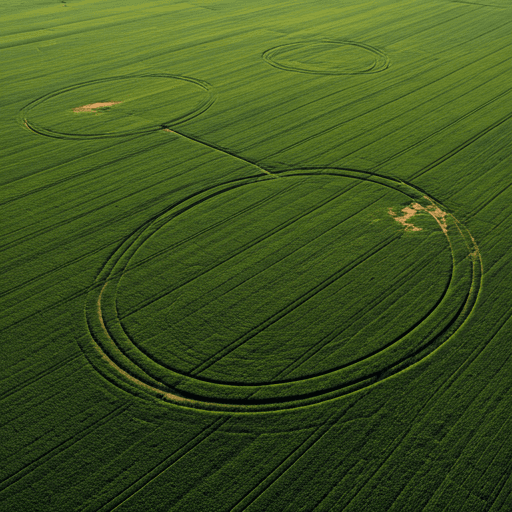
Your dashboard shows each field with its latest health reading and policy, and tells you what needs attention next, whether that is a payment, a document or a claim.
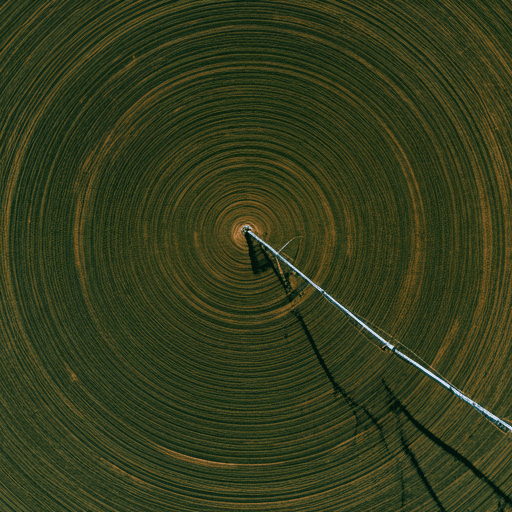
Underwriters and lenders see the same evidence the farmer does, so approvals and reviews are quick and defensible.
Registrations, document reviews, payments, activations, claim decisions and payouts are written to an audit trail with who did what and when, so you can always answer the question later.
Register a field, draw its boundary and see your cover in minutes.